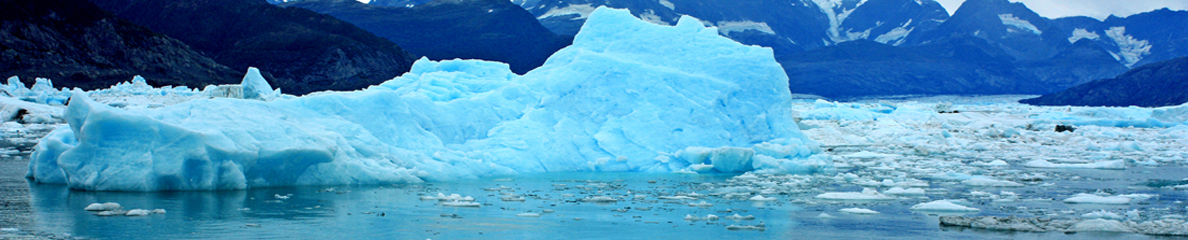
 La fonte du Groenland est visible au niveau des glaciers qui se fracturent et vêlent de plus en plus d’icebergs. Elle se produit aussi à la surface de la banquise où sont apparues des taches bleues qui trahissent des lacs de glace fondue qui sont de plus en plus nombreux et s’agrandissent chaque année. Chaque été, ils apparaissent aussi davantage à l’intérieur des terres et à de plus hautes altitudes que par le passé. Au travers de ses photos, le photographe aérien allemand Timo Lieber dévoile un paysage inattendu du Groenland.
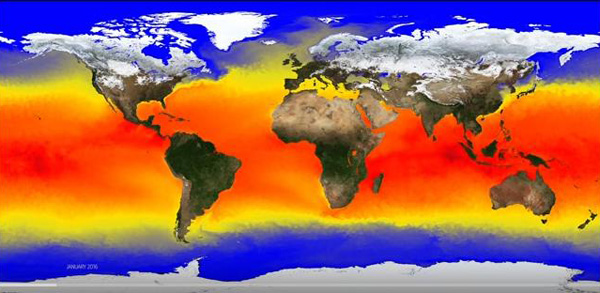
Le projet photographique de Timo Lieber est intitulé Thaw (« fonte », en anglais). A la croisée de la photographie artistique et de la science, il est le fruit d’une collaboration entre le photographe et une équipe de glaciologues. Leur objectif est d’alerter sur la rapide et inquiétante fonte de la calotte glaciaire qui recouvre le Groenland, la plus importante de l’hémisphère Nord.
Timo Lieber explique que « dans ce paysage immaculé, dépouillé au strict minimum de couleurs et de formes, l’impact dramatique du changement climatique est plus manifeste que dans n’importe quelle autre partie du monde […] Cela fait peur à voir de ses propres yeux. Même depuis mon avion de ligne, lors de mon arrivée au Groenland, on pouvait déjà voir le bleu des lacs. On s’attend à un paysage complètement blanc, mais en fait, ce n’est pas du tout le cas ». C’est exactement ce que je me suis dit en survolant le Groenland en septembre 2016 alors que je me rendais en Alaska.
Même si elles traitent d’un sujet grave, les photos de Timo Lieber n’en restent pas moins belles. « Je n’essaie pas d’embellir le problème lui-même », confie Timo Lieber. « Je veux que les gens qui voient ces images se posent cette question : ‘Qu’est-ce qu’il y a derrière toute cette beauté ?' »
Le portfolio groenlandais de Timo Lieber est visible à cette adresse.
http://www.timolieber.com/thaw/view/thaw-1/
Source : France Info.
—————————————-
 The melting of Greenland can be seen at the glaciers which fracture and calve more and more icebergs. It also occurs on the surface of the ice sheet, where blue spots have appeared, betraying melt lakes which are increasingly numerous and growing every year. Each summer, they also appear more inland and at higher altitudes than in the past. Through his photos, the German aerial photographer Timo Lieber unveils an unexpected landscape of Greenland.
The photographic project of Timo Lieber is entitled « Thaw ». At the crossroads of artistic photography and science, it is the fruit of a collaboration between the photographer and a team of glaciologists. Their objective is to alert to the rapid and worrying melting of the ice sheet covering Greenland, the largest in the northern hemisphere.
Timo Lieber explains that « in this immaculate landscape, stripped to the bare minimum of colours and shapes, the dramatic impact of climate change is more evident than in any other part of the world … It’s scary to be seen with one’s own eyes. Even from my airliner, when I arrived in Greenland, I could already see the blue of the lakes.We expect a completely white landscape, but in fact it is not at all the case ». That is exactly what I said to myself while flying over Greenland in September 2016.
Even if they deal with a serious subject, Timo Lieber’s photos remain no less beautiful. « I’m not trying to embellish the problem itself, » says Lieber. « I want people who see these images to ask themselves, ‘What’s behind all this beauty?' »
Tom Lieber’s Greenland portfolio can be seen at this address:
http://www.timolieber.com/thaw/view/thaw-1/
Source: France Info.

Photo: C. Grandpey