Concentrations de CO2 dans l’atmosphère : du jamais vu ! // CO2 concentrations in the atmosphere never seen before

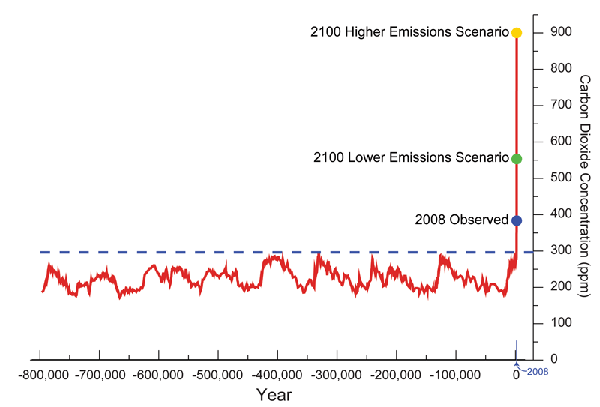
On le savait déjà, grâce à l’analyse des carottes de glace tirées de l’Antarctique : les niveaux de CO2 actuels sont les plus importants des 800 000 dernières années.

Une nouvelle étude publiée dans Science Advances par des chercheurs allemands du Potsdam Institute for Climate Impact Research (PIK) et de l’Institut Max Planck montre que la quantité de gaz à effet de serre dépasse également toute la période du Quaternaire, autrement dit les quelque 2,6 millions d’années écoulées.

L’article publié dans Science Advances reproduit pour la première fois la variabilité climatique naturelle de l’ensemble du Quaternaire avec un modèle de complexité intermédiaire. S’appuyant sur des recherches antérieures, les chercheurs ont reproduit les principales caractéristiques de la variabilité naturelle du climat au cours des derniers millions d’années avec une simulation informatique basée sur des données astronomiques et géologiques et des algorithmes représentant la physique et la chimie de notre planète.

Les niveaux de CO2 sont l’un des principaux moteurs des cycles glaciaires, avec les variations de la rotation de la Terre autour du soleil, les cycles de Milankovitch. La simulation s’est bien sûr appuyée sur ces modifications bien connues de la position de la Terre par rapport au soleil  et sur le dégagement de CO2 des volcans. Mais l’étude s’est également penchée sur les changements dans la répartition des sédiments à la surface de la Terre. Elle a aussi pris en compte le rôle de la poussière atmosphérique qui assombrit la surface de la glace et contribue ainsi à la fonte.

Selon les chercheurs, nous poussons maintenant notre planète au-delà des conditions climatiques rencontrées pendant toute la période géologique actuelle. Les résultats de l’étude corroborent l’idée selon laquelle la concentration actuelle de CO2 – plus de 414 ppm – est sans précédent depuis au moins 3 millions d’années et que la température globale n’a pas dépassé la valeur préindustrielle de plus de 2°C au cours de tout le Quaternaire.

D’après les scientifiques allemands, le Quaternaire aurait connu le scénario suivant :

– Une diminution progressive du CO2 jusqu’à des valeurs inférieures à environ 350 ppm a entraîné le début de la croissance de la calotte glaciaire continentale au Groenland et plus généralement dans l’hémisphère nord à la fin du Pliocène et au début du Pléistocène (de 5,332 millions à 2,588 millions d’années avant notre ère).

– La fin du Pliocène fut relativement proche de nous en termes de niveaux de CO2. Les modélisations suggèrent qu’au Pliocène, il n’y avait ni cycle glaciaire ni grosses calottes glaciaires dans l’hémisphère nord. Le CO2 était trop élevé et le climat trop chaud pour le permettre. D’après le dernier rapport du GIEC, avec des niveaux de CO2 de 400 ppm à la fin du Pliocène, les températures furent 2 à 3°C plus élevées que la période préindustrielle.

– Succédant au Pliocène, le Pléistocène est la première époque du Quaternaire, période caractérisée par l’apparition de cycles glaciaires et interglaciaires, causés par la croissance et le déclin cycliques des inlandsis continentaux dans l’hémisphère nord.

La température globale actuelle, qui est désormais au moins 1°C au-dessus de la période préindustrielle, s’approche des +1,5°C.

Au Pliocène, le niveau de la mer était entre 10 et 40 mètres au-dessus du niveau actuel, en raison de la fonte du Groenland, de l’Antarctique de l’Ouest et d’une partie de l’Antarctique de l’Est. Avec un scénario d’émissions soutenues de CO2, les prévisions du GIEC sont d’environ un mètre à l’horizon 2100 mais on sait déjà que les glaciers continueront à fondre au-delà.

Source : Science Advances, global-climat.

————————————————-

It was already known, thanks to the analysis of ice cores from Antarctica that current CO2 levels were the highest in the last 800,000 years.
A new study published in Science Advances by German researchers at the Potsdam Institute for Climate Impact Research (PIK) and the Max Planck Institute shows that the amount of greenhouse gases also exceeds the whole Quaternary period, ie the last 6 million years.
The article published in Science Advances reproduces for the first time the natural climatic variability of the entire Quaternary with a model of intermediate complexity. Based on previous research, the researchers have reproduced the main features of natural climate variability over the past millions of years with a computer simulation based on astronomical and geological data and algorithms representing the physics and chemistry of our planet.
CO2 levels are one of the main drivers of glacial cycles, with variations in the Earth’s rotation around the sun, the Milankovitch cycles. The simulation was of course based on these well-known modifications of the position of the Earth with respect to the sun and on the release of CO2 from volcanoes. But the study also looked at changes in the distribution of sediments on the surface of the Earth. It also took into account the role of atmospheric dust, which darkens the surface of the ice and thus contributes to melting.
According to the researchers, we are now pushing our planet beyond the climatic conditions encountered throughout the current geological period. The results of the study corroborate the idea that the current concentration of CO2 – more than 414 ppm – has been unprecedented for at least 3 million years and that the global temperature has not exceeded the pre-industrial value by more than 2°C throughout the Quaternary.
According to the German scientists, the Quaternary went through the following scenario:
– A gradual decrease of CO2 to values ​​below about 350 ppm led to the onset of growth of the continental ice cap in Greenland and more generally in the northern hemisphere at the end of the Pliocene and early Pleistocene (from 5.332 million to 2.588 million years before our era).
– The end of the Pliocene was relatively close to us in terms of CO2 levels. Modelling suggests that at the Pliocene there was no glacial cycle or large ice caps in the northern hemisphere. The CO2 was too high and the climate too hot to allow it. According to the latest IPCC report, with CO2 levels of 400 ppm at the end of the Pliocene, temperatures were 2 to 3°C higher than the pre-industrial period.
– Following the Pliocene, the Pleistocene is the early Quaternary period, characterized by the appearance of glacial and interglacial cycles, caused by the cyclical growth and decline of the continental ice sheets in the northern hemisphere.
The current global temperature, which is now at least 1°C above the pre-industrial period, is approaching + 1.5°C.
In the Pliocene, the sea level was between 10 and 40 metres above the current level, due to the melting of Greenland, West Antarctica and part of East Antarctica . With a scenario of sustained CO2 emissions, the IPCC forecasts are about one metre by 2100 but it is already known that glaciers will continue to melt beyond that year.
Source: Science Advances, global-climat. Concentration de l’atmosphère en CO2 au cours des 800 000 dernières années, et projection pour 2100 (Source : NOAA)
Avril 2019 encore trop chaud ! // April 2019 still too hot !

On attend les statistiques de la NASA, mais les centres de prévisions NCEP-NCAR indiquent qu’avec + 0,638°C au-dessus de la moyenne 1981-2010, le mois d’avril 2019 se classe au 2ème rang depuis 1948, date du début des relevés NCEP-NCAR. L’année 2019 est également à la deuxième place derrière 2016 pour le moment.

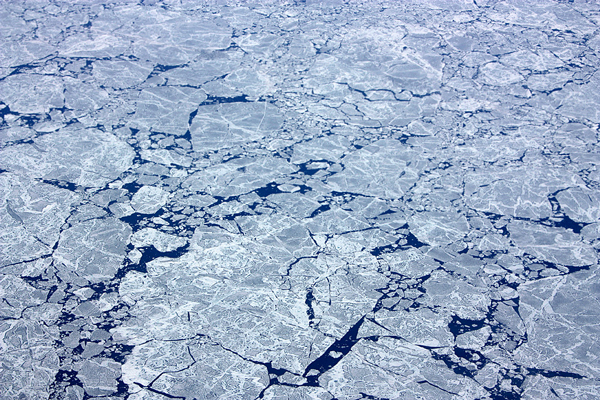
Comme en février et en mars, la moyenne globale élevée est en partie due aux Tropiques (notamment au Vietnam et en Thaïlande), mais aussi aux régions polaires (Antarctique et Arctique). En Scandinavie, Helsinki a franchi les 12°C en moyenne sur la journée du 19 avril 2019, ce qui n’était jamais arrivé aussi tôt depuis 1882.  L’Arctique a signé un record de la plus faible extension de glace de mer pour un mois d’avril.

Source : global-climat.

————————————–

NASA statistics are still to come, but the NCEP-NCAR forecast centers indicate that with +0.638°C above the 1981-2010 average, April 2019 ranks second since 1948, the beginning of NCEP-NCAR surveys. The year 2019 is also in second place behind 2016 at the moment.
As in February and March, the high global average is partly due to the tropics (notably Vietnam and Thailand), but also to the polar regions (Antarctic and Arctic). In Scandinavia, Helsinki averaged 12°C on April 19th 2019, which had never happened so early since 1882. The Arctic has set a record for the lowest sea ice April.
Source: global-climat.

Sale temps pour la glace de mer (Photo: C. Grandpey)

Circulation océanique et climat (2ème partie) // Ocean circulation and climate (Part 2)

Il est difficile de déterminer ce que les schémas évoqués dans la première partie de cet article  pourraient signifier pour l’avenir de la Terre. Des preuves récentes suggèrent que l’AMOC a commencé à s’affaiblir à nouveau il y a 150 ans. Cependant, les conditions actuelles sont assez différentes de celles d’il y a 13000 ans. La température globale était beaucoup plus basse à l’époque, la banquise d’hiver s’étendait au sud de New York et la structure de l’océan était bien différente. En outre, l’affaiblissement passé de l’AMOC fut bien plus important que la tendance actuelle.

Selon un rapport du GIEC, il y a de fortes chances pour que l’AMOC ralentisse au cours du 21ème siècle, mais le phénomène serait très progressif. Un arrêt complet, qui entraînerait une chute rapide de la température de l’Atlantique du Nord, n’aurait que de très faibles chances de se produire au cours du siècle en cours.

Les observations récentes du climat montrent que quelque chose se passe déjà dans l’Atlantique Nord. La région subpolaire au sud de la Groenland, y compris la Mer du Labrador, est quasiment la seule du monde à ne pas s’être réchauffée depuis le début du 20ème siècle. Ce serait l’une des manifestations de l’affaiblissement de l’AMOC, selon une étude parue fin mars 2015, signée par des chercheurs du Potsdam Institute for Climate Research. Les scientifiques estimaient alors que le réchauffement climatique global dû aux émissions humaines de gaz à effet de serre avait déjà commencé à ralentir sérieusement la circulation thermohaline.

D’après un article publié en avril 2018 dans la revue Nature,  le système de circulation de l’Atlantique Nord est dans un état de fragilité sans précédent depuis 1 600 ans. Des questions subsistent quant à la date exacte du début du déclin. Les chercheurs ont découvert que la force de l’AMOC fut relativement stable de 400 à 1850 environ, puis s’est affaiblie au début de l’ère industrielle. Cette transition coïncide avec la fin du petit âge glaciaire qui a touché de nombreuses régions du globe. Les auteurs de l’article estiment que la force de l’AMOC a diminué d’environ 15% pendant la période industrielle, par rapport à son flux des 1 500 dernières années.

L’énigme de l’impact de la circulation océanique sur les températures globales n’est probablement pas résolue. Il n’est en effet pas si certain qu’un ralentissement de l’AMOC favorise dans les prochaines décennies une baisse des températures en Europe, dans un contexte de réchauffement climatique lié aux émissions anthropiques de gaz à effet de serre. En 2018, une autre étude publiée dans Nature a montré que l’AMOC, dans une phase «faible» entre 1975 et 1998, n’avait pas empêché les températures de surface d’augmenter rapidement au cours de la période.

Le réchauffement provoqué par l’homme a-t-il modifié le rôle principal de l’AMOC ? Au lieu de déplacer la chaleur vers le nord, a-t-il désormais pour effet principal de stocker la chaleur dans les profondeurs de l’Atlantique ?

Des analyses du bilan en eau douce basées sur des observations effectuées en 2017 suggèrent que l’AMOC se trouve dans un régime instable susceptible de subir de grands changements.  Cette dernière étude estimait que l’AMOC serait susceptible de s’effondrer 300 ans après un doublement de la concentration de CO2 dans l’atmosphère par rapport au niveau de 1990. L’effondrement de l’AMOC entraînerait d’importantes réactions climatiques : un refroidissement important sur le nord de l’Atlantique Nord et les zones voisines, la glace de mer augmenterait sur les mers Groenland-Islande-Norvège et au sud du Groenland.

Source : global-climat.

   —————————————————–

It is difficult to determine what the patterns mentioned in the first part of this post could mean for the future of the Earth. Recent evidence suggests that AMOC began to weaken again 150 years ago. However, the current conditions are quite different from those of 13,000 years ago. The global temperature was much lower at the time, the winter ice sheet extended south of New York and the ocean structure was quite different. In addition, the past weakening of AMOC was much larger than the current trend. According to an IPCC report, there is a good chance that AMOC will slow down in the 21st century, but the phenomenon would be very gradual. A complete halt, which would bring about a rapid fall in the temperature of the North Atlantic, is unlikely to occur during the current century.
Recent observations of the climate show that something is already happening in the North Atlantic. The subpolar region of southern Greenland, including the Labrador Sea, is virtually the only one in the world that has not warmed since the beginning of the 20th century. This might be one of the signs of the weakening of AMOC, according to a study published late March 2015, by researchers at the Potsdam Institute for Climate Research. Scientists then estimated that global warming due to human emissions of greenhouse gases had already begun to seriously slow down the thermohaline circulation.
According to an article published in April 2018 in the journal Nature, the circulation system of the North Atlantic is in a state of fragility unprecedented for 1,600 years. Questions remain as to the exact date of the onset of decline. The researchers found that the strength of AMOC was relatively stable from about 400 to 1850, then weakened in the early days of the industrial age. This transition coincides with the end of the Little Ice Age that affected many parts of the globe. The authors of the article estimate that the strength of AMOC has decreased by about 15% during the industrial period, compared to its flow of the last 1500 years.
The enigma of the impact of ocean circulation on global temperatures is probably not resolved. Indeed, it is not so certain that a slowdown in AMOC will, in the coming decades, favour a drop in temperatures in Europe, in the context of global warming linked to anthropogenic greenhouse gas emissions. In 2018, another study published in Nature showed that AMOC, in a « weak » phase between 1975 and 1998, had not prevented surface temperatures from rising rapidly during the period.
Has man-made warming changed the main role of AMOC? Instead of moving the heat northward, does it now have the main effect of storing heat in the depths of the Atlantic?
Freshwater balance analyses based on observations made in 2017 suggest that AMOC is in an unstable regime that is likely to undergo major changes. The latest study estimated that AMOC is likely to collapse 300 years after a doubling of the CO2 concentration in the atmosphere compared to the 1990 level. The collapse of AMOC would lead to major climate reactions: cooling in the North Atlantic and surrounding areas, sea ice would increase in the Greenland-Iceland-Norway seas and in southern Greenland.
Source: global-climat.

Schéma montrant la circulation thermohaline [Source : GIEC]

Circulation océanique et climat (1ère partie) // Ocean circulation and climate (Part 1)

Aujourd’hui avec le réchauffement climatique, la crainte n’est plus que le ciel nous tombe sur la tête, mais que la circulation des courants océaniques se modifie, avec de sévères conséquences sur le climat de notre planète. Au cours de mes conférences, j’entends souvent des questions sur cette éventualité.

Ce ne serait pas la première fois que la circulation océanique subirait des modifications. Une nouvelle étude nous donne des précisions intéressantes quand au timing de l’évolution passée de la « circulation océanique méridienne de retournement atlantique », autrement connue sous le nom d’AMOC (Atlantic meridional overturning circulation). Dans l’Océan Atlantique, ce tapis roulant géant transporte les eaux chaudes des tropiques vers l’Atlantique Nord, où elles refroidissent et coulent puis retournent vers le sud dans les profondeurs de l’océan. L’AMOC est ainsi un acteur important du climat mondial, régulant les régimes climatiques dans l’Arctique, en Europe et dans le monde.

A plusieurs reprises, depuis la fin de la dernière glaciation, il y a 20 000 ans, l’AMOC s’est déjà effondré de façon brutale, ramenant le climat à des conditions glaciaires en Europe.

Des indices d’un ralentissement du système sont de plus en plus nombreux et certains scientifiques craignent qu’il puisse avoir des effets majeurs, tels que la baisse des températures en Europe et le réchauffement des eaux au large de la côte est des Etats-Unis, pouvant potentiellement nuire à la pêche et exacerber les ouragans.

Selon les prévisions, le réchauffement de la planète devrait affaiblir l’AMOC mais l’ampleur du changement reste incertaine. La plupart des modèles climatiques prévoient un ralentissement modéré mais pas un arrêt complet de l’AMOC.

Une nouvelle étude publiée dans Nature Communications donne des indications sur la rapidité avec laquelle ces changements ont pu intervenir dans le passé. Une équipe scientifique de l’Observatoire de la Terre Lamont-Doherty de Columbia s’est concentrée sur une zone où l’eau coule de la surface vers le fond de l’Atlantique Nord. D’après les chercheurs, l’AMOC a commencé à s’affaiblir environ 400 ans avant la vague de froid majeure survenue il y a 13 000 ans. Puis l’AMOC a commencé à se renforcer environ 400 ans avant le réchauffement brutal qui s’est produit il y a 11 000 ans. Pour déterminer si les changements passés du transport océanique se produisaient avant ou après les changements brusques de climat qui ont ponctué la dernière déglaciation dans l’hémisphère nord, l’équipe scientifique a rassemblé les données tirées de sédiments au fond de la mer de Norvège, de sédiments lacustres du sud de la Scandinavie et de carottes de glace du Groenland. Les anciennes couches du lac contiennent des plantes en décomposition qui extraient le carbone 14 directement de l’atmosphère, ce qui permet de déterminer l’âge de chaque couche de sédiment du lac. Les auteurs de l’étude ont ensuite fait correspondre les couches de sédiments lacustres aux couches de sédiments marins. Cela a permis de révéler la rapidité avec laquelle l’eau coulait dans cette zone, et donc le processus appelé « formation d’eau profonde » qui est essentiel pour maintenir la circulation de l’AMOC. Pour parachever l’étude, il a fallu analyser les carottes de glace du Groenland et étudier les changements de température et de climat au cours de la même période. C’est ainsi que les chercheurs ont pu mettre en parallèle les changements de la circulation océanique et les changements climatiques.

La comparaison des données des échantillons a révélé que l’AMOC s’est affaibli dans la période qui a précédé la dernière vague de froid majeure de la planète il y a environ 13 000 ans. La circulation océanique a commencé à ralentir environ 400 ans avant la vague de froid, mais une fois que le climat a commencé à changer, les températures au Groenland ont rapidement chuté de 6 degrés environ.

Un schéma similaire est apparu vers la fin de cette vague de froid. Le courant a commencé à se renforcer environ 400 ans avant que l’atmosphère ne commence à se réchauffer de façon spectaculaire, sortant de l’ère glaciaire. Une fois que la déglaciation a commencé, le Groenland s’est réchauffé rapidement : sa température moyenne a augmenté d’environ 8 degrés en l’espace de quelques décennies, ce qui a provoqué la fonte des glaciers et la fonte des glaces de mer dans l’Atlantique Nord.

Source : global-climat.

———————————————

Today with global warming, the fear is no longer that the sky may fall on our heads, but that the circulation of ocean currents might change, with severe consequences on the climate of our planet. During my conferences, I often hear questions about this possibility.
This would not be the first time that ocean circulation would undergo modifications. A new study gives us interesting insights as to the timing of the past evolution of AMOC (Atlantic meridional overturning circulation). In the Atlantic Ocean, this giant conveyor transports the warm waters of the tropics to the North Atlantic, where they cool and sink and then return south into the depths of the ocean. AMOC is thus an important player in the global climate, regulating weather patterns in the Arctic, Europe and the world.
On several occasions, since the end of the last glaciation 20,000 years ago, AMOC has already collapsed abruptly, bringing the climate back to glacial conditions in Europe.
There is growing evidence of a slowing down of the system and some scientists fear that it may have major effects, such as lower temperatures in Europe and warmer waters off the east coast of the United States, potentially harmful to fishing and exacerbating hurricanes.
Global warming is predicted to weaken AMOC, but the extent of change remains uncertain. Most climate models predict a moderate slowdown but not a complete shutdown of AMOC.
A new study published in Nature Communications provides insight into how quickly these changes may have occurred in the past. A scientific team from the Lamont-Doherty Earth Observatory in Columbia has focused on an area where water is flowing from the surface to the bottom of the North Atlantic. According to the researchers, AMOC began to weaken about 400 years before the major cold wave of 13,000 years ago. Then AMOC began to strengthen about 400 years before the brutal warming that occurred 11,000 years ago. To determine whether past changes in ocean transport occurred before or after the sudden changes in climate that punctuated the last deglaciation in the northern hemisphere, the scientific team collected sediment data from the bottom of the Norwegian Sea, lake sediments from southern Scandinavia and ice cores from Greenland. The former layers of the lake contain decaying plants that extract Carbon 14 directly from the atmosphere, allowing the age of each lake sediment layer to be determined. The authors of the study then matched lake sediment layers to marine sediment layers. This revealed the speed with which water was flowing into this area, and thus the process called « deep water formation » which is essential to maintain the circulation of AMOC. To complete the study, it was necessary to analyze the ice cores of Greenland and study the changes in temperature and climate during the same period. As a result, researchers have been able to compare changes in ocean circulation with climate change.
The comparison of the sample data revealed that AMOC weakened in the period before the last major cold wave of the planet about 13,000 years ago. Ocean circulation began to slow down about 400 years before the cold wave, but once the climate began to change, temperatures in Greenland quickly dropped by about 6 degrees.
A similar pattern appeared towards the end of this cold snap. The current began to strengthen about 400 years before the atmosphere began to warm up dramatically, coming out of the ice age. Once the deglaciation began, Greenland warmed rapidly: its average temperature increased by about 8 degrees within a few decades, which caused the melting of glaciers and the melting of sea ice in the North Atlantic.
Source: global-climat.

Schéma montrant la circulation thermohaline [Source : GIEC]